Generally we will debug browser script using alert() method,but recently I came to know that an interesting feature in IE8 - which is very useful in debugging browser script,I thought many of developers not aware of this useful feature from IE so writing this as a post.
We can debug a browser script using IE8 (Internet Explorer 8) developer tool instead of alert() method,The Developer tool is available as free plug-in for IE and Firefox of other versions and its a in-built feature for IE8
Follow the below steps to happily debug your browser script.
1) Compile your script and run genbscript utility for your script,if you are not aware of running genbscript see below example.
Ex: Go to commandpromopt and run below command by changing parameters as per your environment.
C:\Siebel\8.1\Client_1\BIN\genbscript.exe C:\Siebel\8.1\Client_1\BIN\esn\scommwireless_ESN.cfg C:\Siebel\8.1\Client_1\public\esn
2) Login to your local or dedicated client.
3) Navigate to the view where your browser script is written.
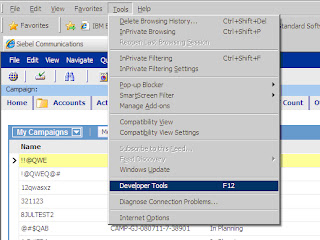
4) Select Tools --- > Developer Tools on your IE 8 explorer. (or press F12),Developer Tool window will open

5) In the Developer Tool window navigate to Script tab and then select your browser script from the drop down option.
6) Your browser script is visible on the screen, now place break points on your code by just with a mouse click.

7) Select Start Debugging option and click OK on the alert window. Perform the actions on application that triggers your browser script
8) Control halts at your break point in the code. You can also see values for the local variables.
Hmm,thats all about it folks,hope you like this feature and start using it,Do write your comments or any other features to debug script :)
Narendra Meka
We can debug a browser script using IE8 (Internet Explorer 8) developer tool instead of alert() method,The Developer tool is available as free plug-in for IE and Firefox of other versions and its a in-built feature for IE8
Follow the below steps to happily debug your browser script.
1) Compile your script and run genbscript utility for your script,if you are not aware of running genbscript see below example.
Ex: Go to commandpromopt and run below command by changing parameters as per your environment.
C:\Siebel\8.1\Client_1\BIN\genbscript.exe C:\Siebel\8.1\Client_1\BIN\esn\scommwireless_ESN.cfg C:\Siebel\8.1\Client_1\public\esn
2) Login to your local or dedicated client.
3) Navigate to the view where your browser script is written.
4) Select Tools --- > Developer Tools on your IE 8 explorer. (or press F12),Developer Tool window will open

5) In the Developer Tool window navigate to Script tab and then select your browser script from the drop down option.
6) Your browser script is visible on the screen, now place break points on your code by just with a mouse click.

7) Select Start Debugging option and click OK on the alert window. Perform the actions on application that triggers your browser script
8) Control halts at your break point in the code. You can also see values for the local variables.
Hmm,thats all about it folks,hope you like this feature and start using it,Do write your comments or any other features to debug script :)
Narendra Meka


3 comments:
This really helped me...and saved a lot of time..
Thanks...
very help full..thanks for ur post
Its really useful post
Thanks for posting
Post a Comment