Generally we will debug browser script using alert() method,but recently I came to know that an interesting feature in IE8 - which is very useful in debugging browser script,I thought many of developers not aware of this useful feature from IE so writing this as a post.
We can debug a browser script using IE8 (Internet Explorer 8) developer tool instead of alert() method,The Developer tool is available as free plug-in for IE and Firefox of other versions and its a in-built feature for IE8
Follow the below steps to happily debug your browser script.
1) Compile your script and run genbscript utility for your script,if you are not aware of running genbscript see below example.
Ex: Go to commandpromopt and run below command by changing parameters as per your environment.
C:\Siebel\8.1\Client_1\BIN\genbscript.exe C:\Siebel\8.1\Client_1\BIN\esn\scommwireless_ESN.cfg C:\Siebel\8.1\Client_1\public\esn
2) Login to your local or dedicated client.
3) Navigate to the view where your browser script is written.
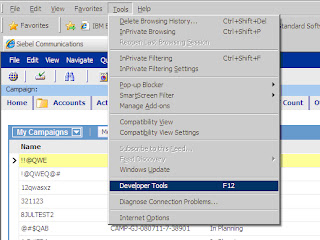
4) Select Tools --- > Developer Tools on your IE 8 explorer. (or press F12),Developer Tool window will open
We can debug a browser script using IE8 (Internet Explorer 8) developer tool instead of alert() method,The Developer tool is available as free plug-in for IE and Firefox of other versions and its a in-built feature for IE8
Follow the below steps to happily debug your browser script.
1) Compile your script and run genbscript utility for your script,if you are not aware of running genbscript see below example.
Ex: Go to commandpromopt and run below command by changing parameters as per your environment.
C:\Siebel\8.1\Client_1\BIN\genbscript.exe C:\Siebel\8.1\Client_1\BIN\esn\scommwireless_ESN.cfg C:\Siebel\8.1\Client_1\public\esn
2) Login to your local or dedicated client.
3) Navigate to the view where your browser script is written.
4) Select Tools --- > Developer Tools on your IE 8 explorer. (or press F12),Developer Tool window will open


